
Cartography
Give addresses an operational meaning
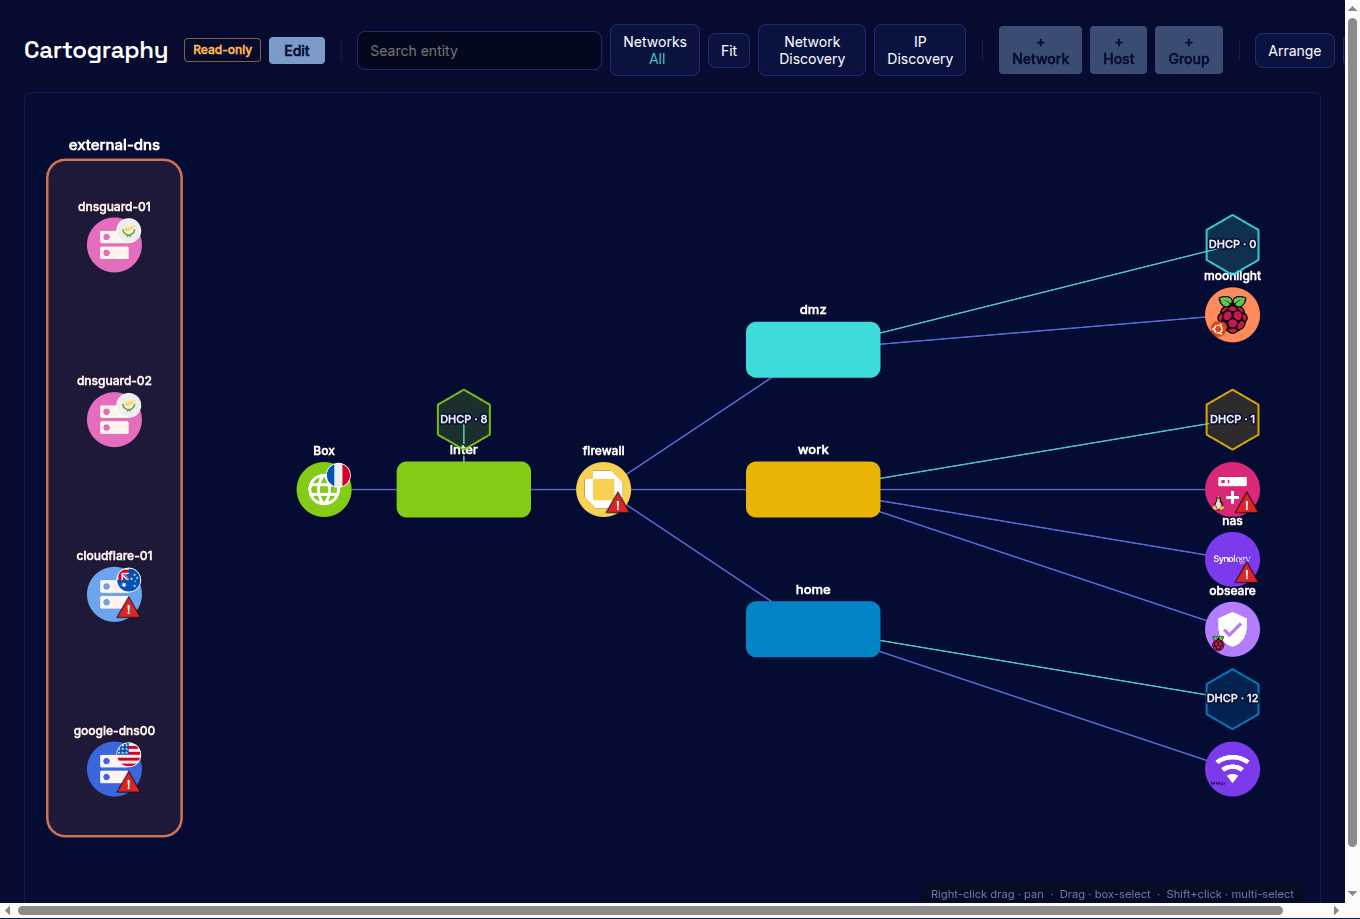
Model networks, hosts, groups and services as named assets. Observe relationships on a live graph and adopt useful discoveries into the cartography.
Technical details →obserae combines collection, asset context, intended connectivity, detection and investigation in one self-hosted application designed for small and mid-sized teams.
Each stage adds context to the same network observation instead of handing data between separate products.
Receive NetFlow v5/v9 and IPFIX from routers, firewalls, switches, hypervisors or standard probes.
Fold records into bidirectional sessions and associate addresses with networks, hosts, groups and services.
Evaluate observed traffic against intended connectivity, explicit rules, threat context and behavioural baselines.
Search retained evidence with NFQL, triage alerts and send structured results to existing operational tools.
The interface moves from understanding the environment to reviewing the conversations that do not fit.
Model networks, hosts, groups and services as named assets. Observe relationships on a live graph and adopt useful discoveries into the cartography.
Technical details →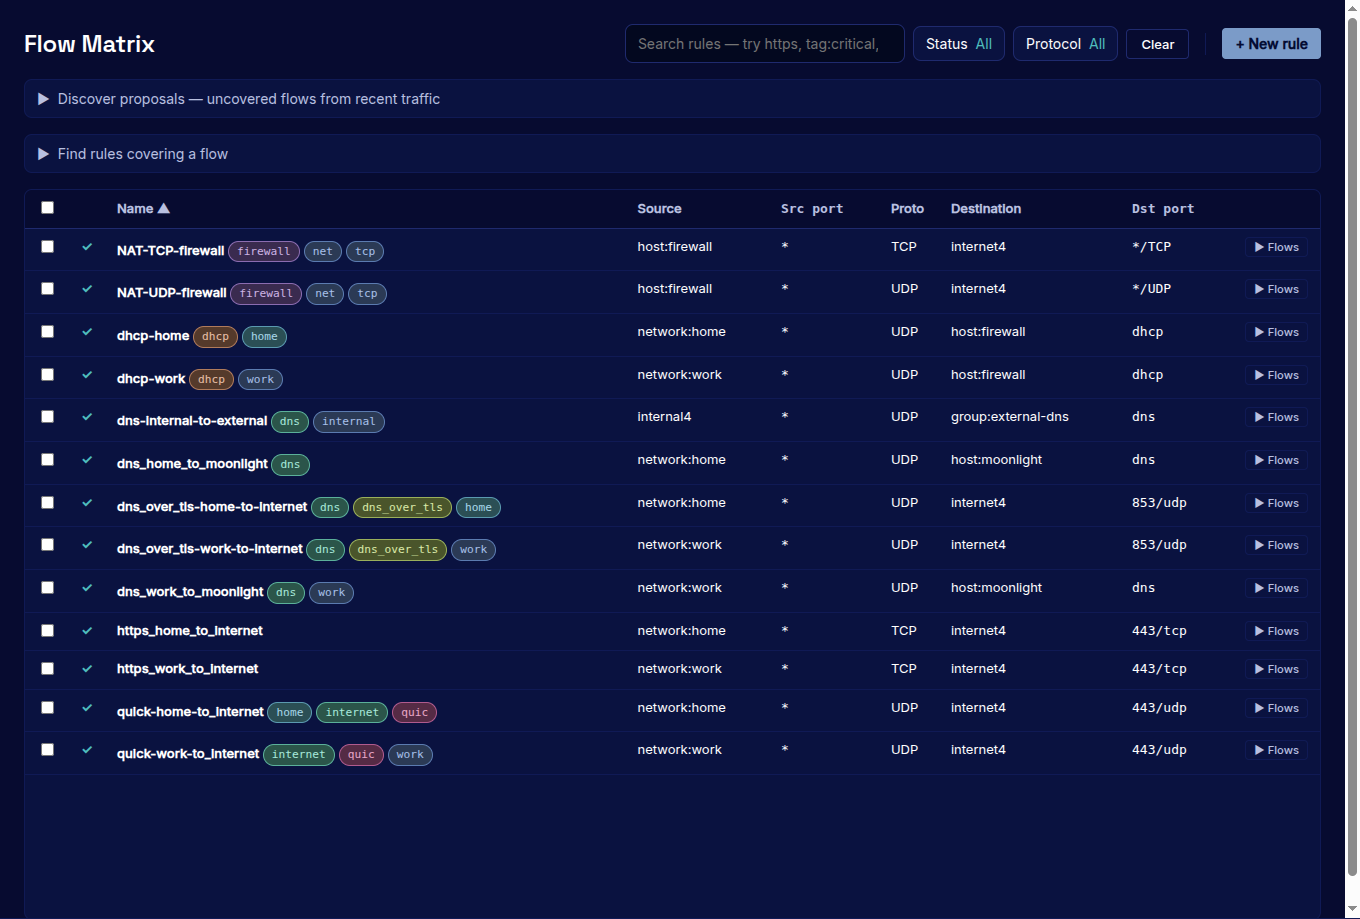
Declare which named sources, destinations and services are expected to communicate, then expose sessions that fall outside that model.
Technical details →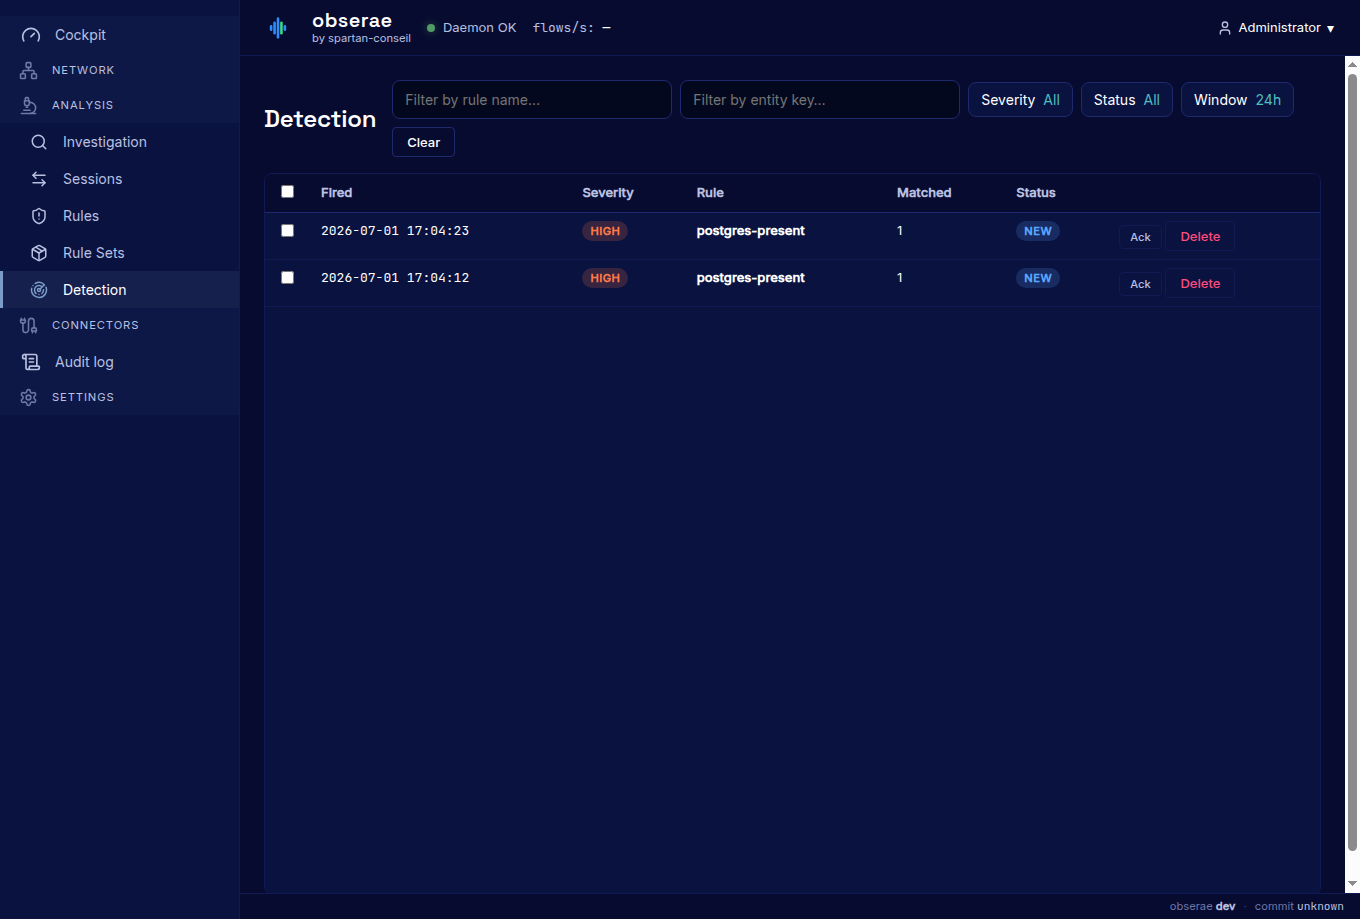
Triage threshold, policy, threat-intelligence and anomaly alerts with severity, lifecycle, matching rows and retained query context.
Technical details →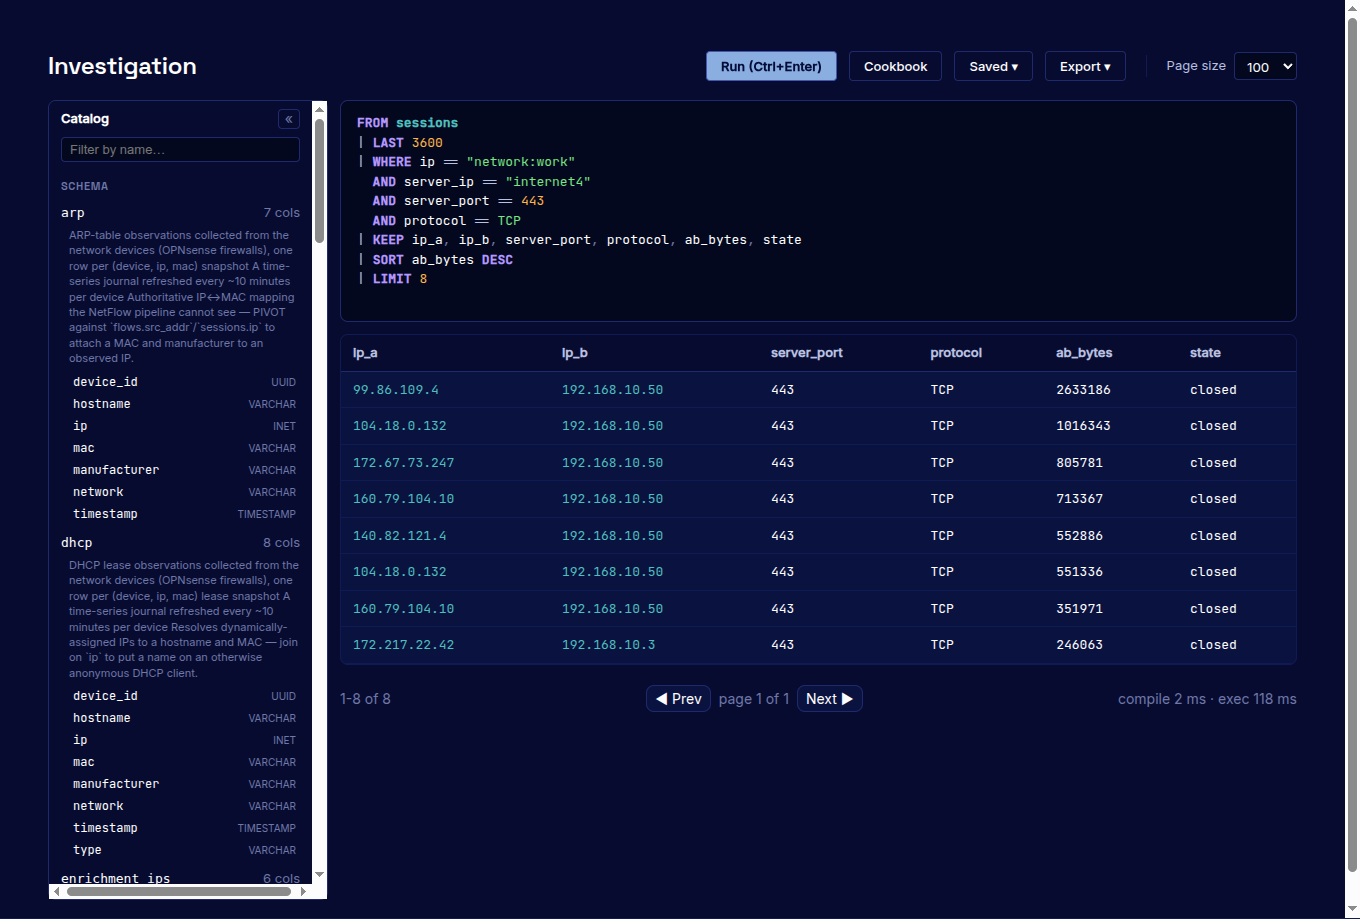
Query flows and sessions by asset name, group, network, service, time, volume and enrichment. Save a useful question as an alert.
Technical details →The technical design keeps deployment and maintenance proportionate to the problem being solved.
Collection, storage, analysis, rules, API and interface run together without Kafka, Elasticsearch, Redis or a mandatory SaaS service.
obserae receives exported metadata. An outage pauses visibility and alerting but cannot interrupt production connectivity.
Flow and session history is written to Parquet; configuration and product state use an embedded database. Retention remains under operator control.
Queries, rule evaluation, baselines, sizing assumptions, APIs, data paths and failure modes are described in the public documentation.
obserae focuses on network-flow telemetry. The scope is deliberately narrower than a platform that captures packets or combines many proprietary sensors.
| Native input | What obserae uses from it |
|---|---|
| NetFlow v5 | Addresses, ports, protocol, timestamps, counters and exporter context |
| NetFlow v9 | Template-based flow fields supplied by the exporter |
| IPFIX | Standards-based information elements supplied by the exporter |
The product does not natively ingest sFlow or cloud-provider flow-log files, although an external conversion path can sometimes produce compatible NetFlow or IPFIX. It does not retain full packet content or inspect Layer 7 request bodies and transferred files.
That boundary keeps the data and infrastructure compact. Flow metadata still records the existence, direction, duration and volume of a conversation — the facts needed to map relationships, compare traffic with policy, enrich public peers and detect many useful changes.
Raw exporters describe flows from their own point of view. A conversation may produce several records over time and may be observed by more than one device. obserae folds those records into bidirectional sessions, identifies the client and server sides, and consolidates duplicate views of the same conversation.
This makes a result useful to an operator: one named relationship with packets and bytes in each direction, rather than a sequence of unrelated exporter rows. NAT declarations can preserve the real conversation when a firewall translates addresses between observation points.
The product supports several complementary forms of detection:
The operator can inspect the query, parameters, matching rows and context behind a signal. Statistical methods and learning windows are documented, including their assumptions and tuning controls. The goal is not to produce a mysterious risk score; it is to preserve enough evidence for a person to understand why the event deserves attention.
The same application exposes ingestion health, pipeline saturation, memory activity, storage growth and rule execution. Retention policies, scheduled backups and point-in-time recovery are built in. Configuration and cartography can be exported as YAML, while signed releases, checksums, an SBOM and build provenance support software verification.
The compact architecture has an explicit trade-off: one instance is a single point of failure. Since obserae is outside the traffic path, this affects visibility rather than network availability. The operating model favours sizing, monitoring, backup and restore over requiring a small team to maintain a distributed cluster.
Alerts can be sent to chat, ticketing, on-call, SIEM, search and webhook destinations. A documented REST API and alert contract support SOAR and SIRP workflows. The structured alert carries its query, matching rows and resolved context so a receiving system can make a decision without first ingesting every raw flow.
obserae does not block traffic. Containment remains with a firewall, NAC, endpoint or orchestration platform authorised to act. This separation keeps the NDR passive and lets each organisation define which responses are safe to automate.
The product does not claim the same breadth as a high-end packet-inspecting platform. Its principal boundaries are clear:
Those choices are what allow the complete workflow to remain understandable and operable on infrastructure suited to a small or mid-sized organisation.
Install obserae, connect one exporter and follow a conversation from collection to investigation.